Share this
by Dane Czaplicki on Jul 10, 2023
Members' Wealth Quarterly Update | Q2 2023
Q2 2023 - Navigating the Complexities: Assessing the Market Landscape and Economic Indicators
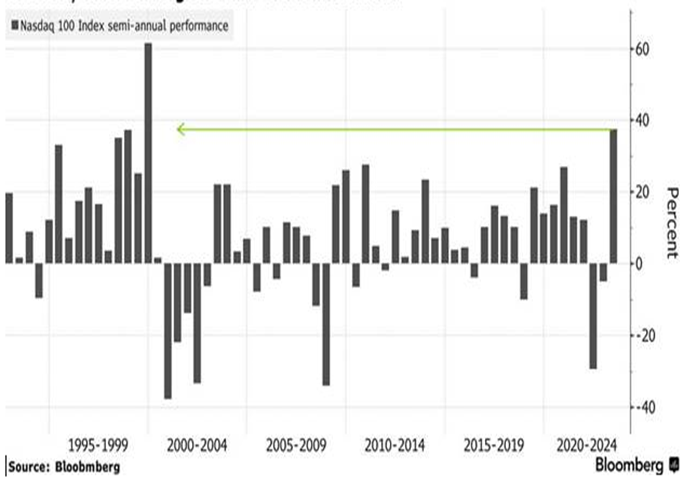
Defying just about everyone, the U.S. equity market, as measured by the S&P 500 has finished the first half of 2023 up nearly 17%. However, the headline result is a bit misleading. The underlying results varied widely (See Table 1 US Sector ETF Returns*) with a few sector standouts, Information Technology, Communication Services, and Consumer Discretionary, up 40% 36%, and 23%, respectively. Thus far in 2023, diversification has not really been your friend. A perceived or real topping off of interest rates, coupled with the explosion of Artificial Intelligence (AI) into the mainstream, propelled the often seemingly insurmountable tech companies to their best first half of the year since the internet bubble in 1999 (See Figure 1). AI has some powerful potential (albeit some a bit scary) but if it is like most technology adoption, the jury is out on whether its applications will actually initiate a productivity boom and boost earnings for all companies. Time will tell.

In the aggregate – the first half of the year was good for stocks and though we cannot predict the future with any better accuracy than most; we must look out to the second half of the year and into early 2024 and make sure we have client portfolios positioned for whatever is to come.
Figure 1-Best 1st Half of Year for Nasdaq 100 Since 1999
In an effort to continually help our clients, we thought, rather than trying to predict certain outcomes, we would help prepare our clients for any outcome through education.
Education -What are leading economic indicators?
Leading Economic Indicators[i] (LEIs) provide an early indication of significant turning points in the business cycle as well as where the economy may be heading in the near term. The yield curve, durable goods orders, the stock market, manufacturing orders, and building permits are some of the best indicators to use when trying to determine where the economy is headed. The most recent data we have at this time is through May 2023. Through May, The Conference Board Index of Leading Economic Indicators just printed its 14th month in a row of declines. The Conference Board continues to expect a contraction from Q3-2023 through Q1-2024. (See Figure 2)
Figure 2 U.S. LEI continues to signal a recession within the next 12 months
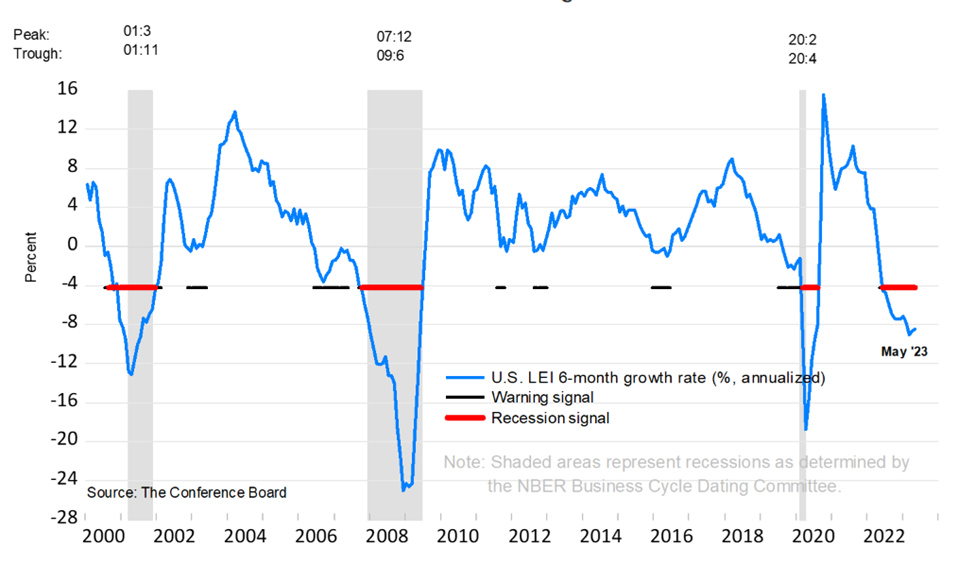
However, although the stock market is also a leading indicator, it seems as though it has not received the message that we are headed for a recession. Or perhaps the market can hang in there while the economy experiences a slowdown?
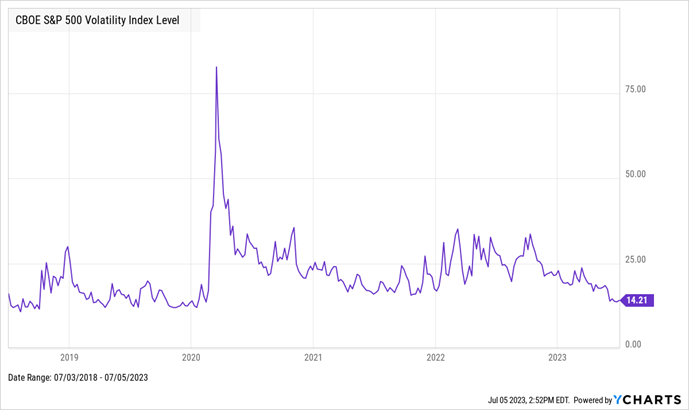
Also perplexing is the lack of volatility in the marketplace. I think if you asked most investors, they would say this was a volatile year. But, as measured by the Volatility Index (VIX)(See Figure 3), this is shaping up to be the least volatile year since before COVID. Sometimes, what you feel is not what is actually going on. This might just be another example of why we recommend not making decisions based on emotion or feeling but instead based on good long-term thinking and sound information.
Figure 3 - Volatility as Measured by the VIX
So what are investors to do with a stock market that is moving higher based only on a select few industries, relatively low volatility, and dare we say calm? Yet at the same time, the leading economic indicators, including the fairly rare, now long-lasting inverted yield curve environment, are mostly pointing to recession. Well at Members’ Wealth, we help guide our investors through all market cycles. We do this by focusing on risk and return opportunities not only within each investment asset class but between each asset class: investment selection and allocation size. We then combine these decisions with a focus on your specific short and long-term goals in a tax-efficient fashion to come up with what is the most suitable custom portfolio for you.
Investment Opportunities and Risk by Major Asset Class
Cash – Not an Expensive Place to Park
Like parking at an Eagles game or Taylor Swift concert, parking your money in cash historically has been quite an expensive proposition. Today the parking costs of cash are more bearable, but like that game or concert, you do not want to sit too long, or you might miss out on the action. Much of what we have said in the last two quarters regarding cash remains even more relevant today.
“There is no doubt that cash yields are nothing short of awesome right now. In fact, we are starting to hear investors get as excited about cash yields as they were about Bitcoin, growth stocks, etc. Sentiments such as, “No one has ever lost money holding cash”; “I have no risk with cash” and “Why would I buy a 2, 5, 10-year bond with a lower yield when I can just hold it in higher yielding, risk-free cash” are starting to surface.”
While you can enjoy the yield on your parked cash, for now, we get nervous when others see no risk. Thus, we must continue to warn investors of the risk of cash. (For stated risks, See Not So Fast: Members' Wealth Quarterly Update | Q1 2023. And remind investors not to overlook longer-dated, slightly lower-yielding, high-quality securities.
High-Quality Bonds – Don’t Miss Out
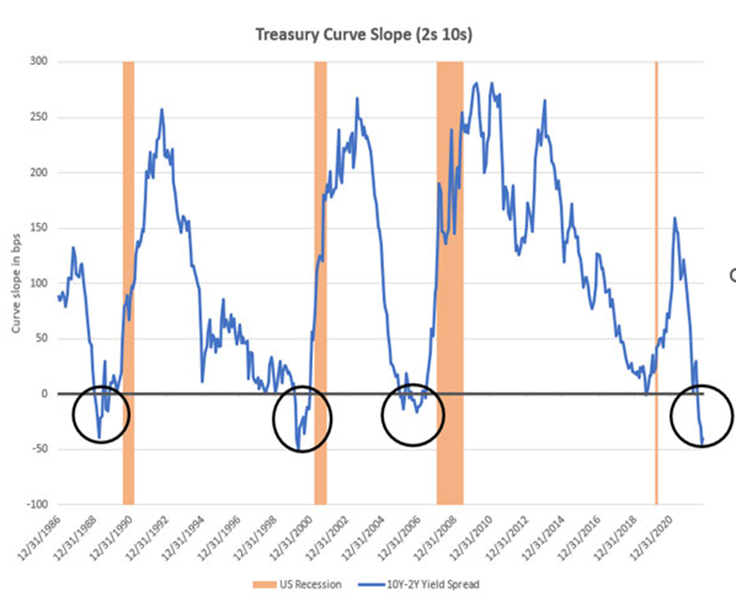
We warn investors not to be too short-sighted when it comes to the inverted yield curve. Tempting as it is to load up on short-dated bonds that have higher yields than long-dated bonds, we remind investors these periods of extended yield curve inversions are rare (See Figure 4[ii]). It is estimated that 90%[iii] of the time, the yield curve is not inverted, but rather upward-sloping.
Figure 4 - Periods of Sustained Curve Inversion since 1982
The appeal of short-term rates could cause investors to disproportionately allocate their investments on the short end of the curve. However, investors risk missing the bigger message – and potential opportunity – the inverted curve may be suggesting.
In the past, yield curve inversions have served as an economic warning signal of a potential recession. These inversions occur when the Federal Reserve is tightening monetary policy in an effort to try to slow high-flying inflation or an overheated economy, as they are now. What the inversion is predicting is that the Fed will succeed in its efforts. Based on the inversion and Federal Chairman Jerome Powell’s messaging, it should come as no surprise, that many are predicting a recession, although, timing that prediction correctly is a daunting exercise.
According to an article by US Bank[ii], the yield curve first inverted on April 1, 2022, when comparing two of the key indicator rates along the curve – the 2-year Treasury note, and the 10-year Treasury note. After a short period of time, yields reverted to a normal curve, but an inversion between the 2-year and 10-year Treasuries occurred again in early July 2022. Just a few months later, in late October, the yield on the very short-term 3-month Treasury bill moved above that of the 10-year Treasury note. The inversion became more pronounced toward the end of 2022 and the spread widened in 2023. Interest rates paid by 3-month Treasury bills are, as of this writing, more than 1.75% higher than those available from 10-year Treasury notes.
Figure 5 - US Treasuries Yield Curve 04/01/2022 vs 06/30/2023[iii]
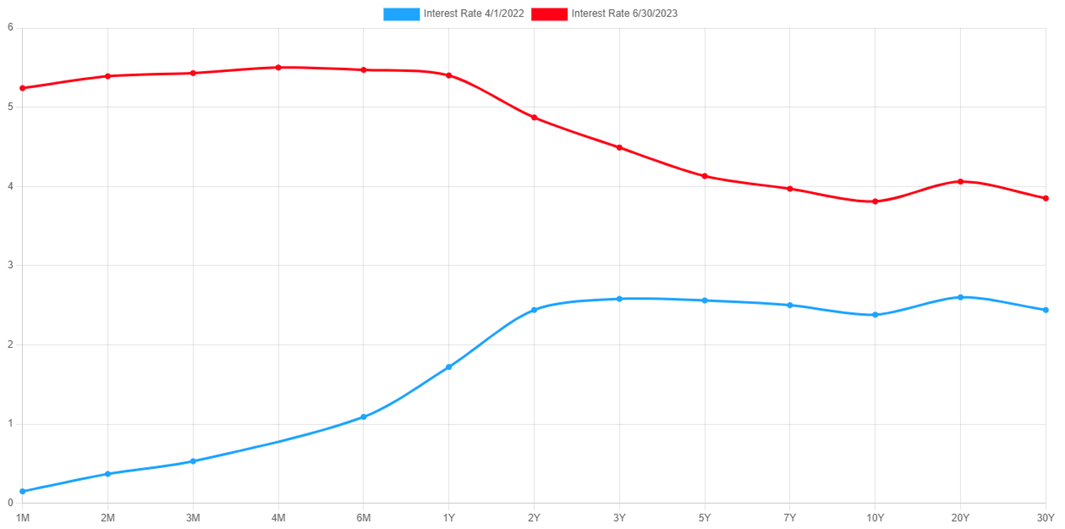
The last time the yield curve was inverted to this extent was before the 2008 financial crisis. If you bought the 1-year Treasury back on December 29, 2006, you earned a one-year return of 5%, then a higher yield than the 10-year Treasury at 4.71%. By December 2007, the 1-year Treasury yield dropped to 3.34% and by December 2008, the 1-year Treasury was yielding under 0.50%. Reinvestment risk indeed! Alternatively, if you bought the lower yielding 10-year Treasury at 4.71%, you received 4.71% for a decade, while the 1-year Treasury remained below 1% for the better part of a decade.
We are not saying investors must go “all in” on long-maturity bonds. Every environment is different, and this current yield curve inversion could last longer than most, but thinking about extending your bond maturities and utilizing bond ladders are good topics for discussion with your advisor.
High Yield Bonds – Uh Oh! - Corporate bankruptcies and defaults are surging[iv]
According to Moody’s Investors Service, corporate defaults rose through May, with 41 defaults in the U.S. so far this year, more than double the same period last year. Companies, under heavy debt loads, when in more forgiving economic conditions could easily refinance their debt, and for the last 15 years were able to do so at lower interest rates, are now facing a much less forgiving environment. Some recent data:
- According to M3 Partners. “Look at the cost of debt. You could reasonably get debt financing for 4% to 6% at any point on average over the last 15 years. Now that cost of debt has gone up to 9% to 13%.”
- Through June 22, there were 324 bankruptcy filings, not far behind the total of 374 in 2022, according to S&P Global Market Intelligence. There were more than 230 bankruptcy filings through April of this year, the highest rate for that period since 2010.
- Moody’s expects the global default rate to rise to 4.6% by the end of the year, higher than the long-term average of 4.1%. That rate is projected to rise to 5% by April 2024 before beginning to ease.
At Members’ Wealth, we are measured in our use of High Yield Bonds or junk bonds for investors. For some, we may not use them at all, for others, we use them sparingly and only through the use of carefully selected investment managers that have deep experience investing in the space. It is good to see investors achieving much higher yields than they have in recent memory, perhaps even more commensurate with the risk. However, in our opinion, we have not witnessed a true “painful” credit cycle since the 2008-2009 time period. We urge caution and selectivity; but also appreciate that when others are fretting about the risk, the discerning investor can be rewarded.
Exploring Alternative Investments: Spotlight on Options for Strategic Portfolio Management
Members’ Wealth uses the term alternatives as a catch-all phrase for strategies that fall outside of traditional asset classes such as cash, stocks, and bonds. While each of the traditional asset classes may be incorporated into an alternative investment strategy, the approach to their utilization can vary significantly from their traditional utilization (i.e. equity market neutral, convertible bond arbitrage, etc.). Alternatives also utilize non-traditional asset classes such as commodities, private equity, and real estate, etc. Given the immensity and heterogeneity of the alternative landscape, we prefer to narrow our focus by highlighting a particular opportunity in the alternative realm each quarter.
This quarter’s alternative spotlight focuses on Options[v]:
Options are financial instruments, also known as derivatives. Options convey to the purchaser (the option holder) the right, but not the obligation, to buy or sell a set quantity or dollar value of a particular asset at a fixed price by a set date. Options offer various ways to make money. For example,
- Buy a Call: If you believe a stock will increase in value, you can purchase a call option, allowing you to buy it at set price for a set period of time. If the stock price rises, you can sell the option and profit.
- Buy a Put: If you anticipate a stock will drop, you can acquire a put option, enabling you to sell it at a set price. If the stock price falls, you can sell the option for a gain.
- Selling Covered Calls is an options strategy where an investor who owns the underlying stock sells call options to earn additional income, giving the buyer the right to purchase the stock at a predetermined price within a specified time period.
- Collaring is an options strategy that involves simultaneously buying a protective put option and selling a covered call option to limit the potential downside and upside of owning a particular stock.
This just highlights some of the basic strategies. It is and can get increasingly more complicated.
At Members’ Wealth, we do not use options for speculation. Where deemed appropriate for a particular investor and where there is a specific need, we take the time to educate investors about the pros and cons of using various options’ strategies to protect their portfolio from an adverse outcome, defer taxes, or generate income.
Options strategies are not for everyone and for those whom they are deemed as an appropriate investment, there may only be the need to consider using them from time to time. Given the recent return to a lower volatility environment, the absolute cost of hedging through put options has come down. So for those, with a bit of trepidation about the equity and bond markets, who are looking to potentially lower risk while remaining invested, it may be the time to revisit your options playbook.
We at Members’ Wealth must talk with investors individually when we think they may want to consider options. If you are interested in learning more, we would be happy to discuss the opportunities more in-depth as well as discuss if it would be an appropriate investment for your portfolio.
Equities – Navigating Market Breadth: Debunking Myths and Assessing the Impact on Investments
We read and listen to the major news outlets because our clients do. We must be conversant in the topic du jour and prepared to support or debunk the “myths” or “distractions” that typically make headlines. News stories are often just that: Stories. Even in truth, is the information actionable? We would be lying if we said we never succumb to the temptation of headlines and talking pundits. So, we cannot expect our clients to be impenetrable unemotional walls of rationality who never have initial reactions to the ever changing of news that surrounds us.
In an effort to navigate this rationally, we have built an actionable plan to combat these challenges so that we do not react inappropriately and in turn, impact our investors’ long-term goals. We listen, write down what we hear, and then go challenge it. Then, once we have a solid understanding of the true nature of the story, we decide if any of it should impact our current portfolio positioning. Case in point.
The Story of Market Breadth:
Some background: The price of the S&P 500, a “market cap weighted” index (traded as the SPDR S&P 500 ETF (SPY)) is up nearly 16% year-to-date (YTD) through June 30. Compared with the price of an ‘equal-weighted’ index of the S&P 500 (traded as Invesco S&P 500 Equal Weighted ETF (RSP)), which is comprised of the same stocks but with each of the 500 weighted equally, is up less than 6% over the same time period. (See Figure 6)
Figure 6 - 2023 YTD (06.30.2023) Return of Market Cap vs. Equal weighted S&P 500 stocks
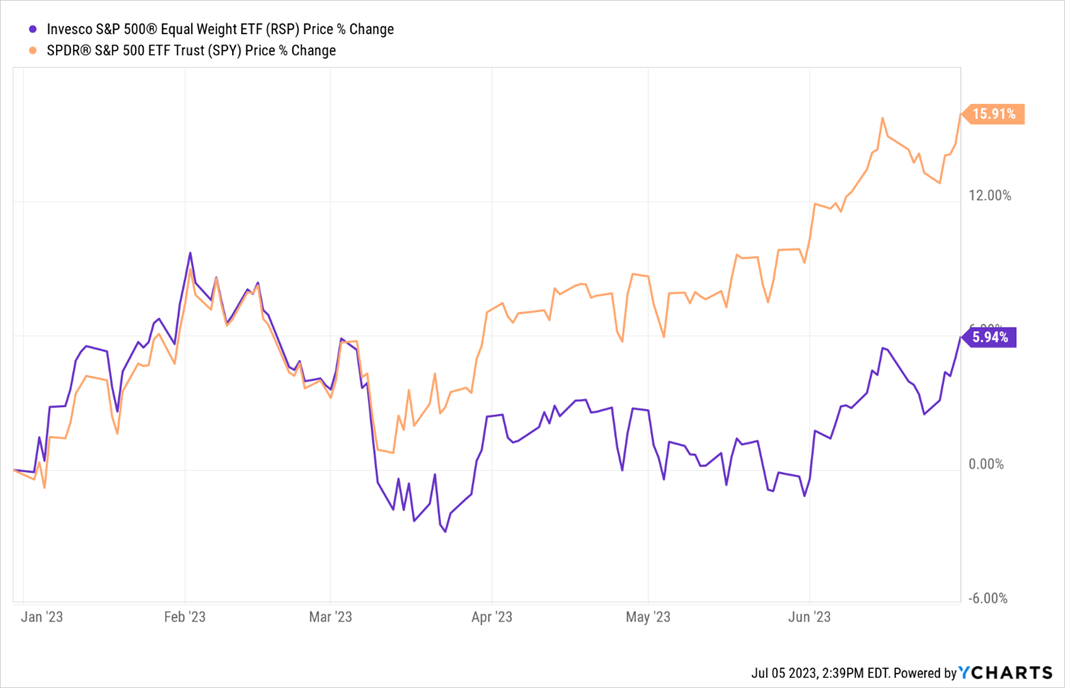
This is where the concern really builds. A small subset of large tech, many of which are caught up in the hoopla around generative artificial intelligence, has driven most of the U.S. equity market’s positive returns in 2023.
According to Jamie McGeever, writing for Reuters[vi], The NYSE FANG+TM index of mega tech stocks is up 65%, compared with the S&P 500's 16%. Just seven tech stocks have driven nearly all of the S&P 500's positive returns this year, according to Barclays; and the combined weight of five tech stocks - Apple, Microsoft, Alphabet, Amazon and Nvidia - is over a quarter of the index. That's a record share for five stocks. Some additional points of late:
- According to Ed Clissold at Ned Davis Research, the percentage of stocks outperforming the S&P 500 this year is just 24.5%. If that holds to Dec. 31, it will be the lowest in at least 50 years.
- And it is shrinking. The percentage of S&P 500 stocks outperforming the index on a rolling three-month basis is just 20.3%, a record low.
- Clissold says that the S&P 500's one-year gain after periods of relative strength by a small group of large caps is an average of 1.8%. That's significantly below the average of 8.2% over any given 12-month period in the past 50 years.
Those posturing on narrow breadth in the stock market and its implications argue that a narrow market, where only a few high-flying stocks drive most of the index's gains, could be a reason to be bearish on the overall market. However, there are differing perspectives on this issue. Riverfront Investment Group recently released a piece: “Narrow” Markets are Not a Bad Omen for Stocks-Dispelling Three Widely Held Perceptions About the Current Stock Rally[vii]. We will attempt to summarize it here.
- Historical evidence does not consistently support the notion that narrow breadth is detrimental to future market returns.
- Narrow markets in bull markets often don't persist and they don't always result in a downward spiral.
- In many instances, the rest of the market catches up, broadening the breadth and adding to the stock rally.
- For example, periods like 1980 and 2020 saw the S&P 500 rise significantly after narrow breadth phases.
- Various market breadth indicators suggests that breadth is improving in June 2023
- Advancers are starting to outnumber decliners.
- The majority of stocks are trading above their moving averages.
- The current S&P 500 does not appear dramatically overvalued, trading at around 18 times 12-month forward earnings estimates, however, nor does it seem cheap.
- Current valuation is higher than the long-term average, but it is nowhere near the extreme levels witnessed during the late 1990s "Tech Bubble."
In conclusion, the debate surrounding the narrow breadth of the stock market is ongoing. While historical evidence and current market indicators challenge the notion that narrow breadth is inherently detrimental, there are valid concerns about the sustainability and potential vulnerabilities associated with concentrated market leadership. As always, at Members’ Wealth, we would like to continue to reiterate the importance of not becoming too concentrated in any one particular stock or sector. Concentration is a double-edged sword. However, if you have found yourself in the good fortune of a highly appreciated concentrated stock position, we can help. Speak to us about hedging opportunities with options, exchange funds, and other techniques.
Managing Concentration Risk for the Charitably Inclined
Managing concentration risk from a successful investment with a large capital gain can be challenging. Often, reducing concentration risk can be good for the portfolio and good for those in need, while simultaneously keeping the tax man at bay. Charitably inclined tax strategies to discuss with your Members’ Wealth team and your accountant include but are not limited to:
1. Setting up a Charitable Gift Annuity with your Alma Mater;
2. Establishing a Charitable Remainder Trust;
3. Establishing a Private Foundation;
4. Setting up a Donor Advised Fund;
For more on each of these and others, please reach out for a more detailed writeup or conversation on the particulars of anyone of these strategies.
With Trepidation, we move forward toward your goals
2023 has started off better than most had expected with both equity and bond markets positive for the first half. Long term, we are positive about the potential reward of both bond and equity investing to help you accomplish your goals. In the short run, arrows point to increased volatility in the second half with hopefully more sectors joining the upward march and with continued rewarding yields from bonds.
Thank you for your support and we look forward to seeing you at your next review meeting.
Your Members’ Wealth Team
Dane Czaplicki, CFA | Colleen Mahoney | Brian Carr, CFA
Tim Thomas | Marie Feindt, J.D. | Tim Macarak, CFP
[i] https://www.conference-board.org/topics/us-leading-indicators
[ii] https://www.usbank.com/investing/financial-perspectives/market-news/treasury-yields-invert-as-investors-weigh-risk-of-recession.html
[iii] https://www.ustreasuryyieldcurve.com/
[iv] https://www.cnbc.com/2023/06/24/high-interest-rates-economic-uncertainty-boost-corporate-defaults.html
[v] An option is a financial instrument known as a derivative that conveys to the purchaser (the option holder) the right, but not the obligation, to buy or sell a set quantity or dollar value of a particular asset at a fixed price by a set date.
[vi] https://www.reuters.com/markets/europe/top-heavy-ultra-narrow-wall-st-needs-bulk-out-2023-06-02/
[vii] https://www.riverfrontig.com/insights/narrow-markets-are-not-a-bad-omen-for-stocks/
You can learn more about how we serve our clients by tapping the button below.
Alternative investments, including hedge funds, involve risks that may not be suitable for all investors. These risks include (but are not limited to), the possibility that the investment may not be liquid, speculative investment practices may increase the risk of investment loss and higher fees may offset any potential gains. Investors should consider the tax consequences, costs and fees associated with these products before investing.
CS Planning Corp., doing business as, Members’ Wealth LLC provides investment advisory, wealth management, and other services to individuals, families, and institutional clients. Advisory services are offered through CS Planning Corp., an SEC registered investment advisor. Members’ Wealth does not provide legal, accounting or tax advice. Please consult your tax or legal advisors before taking any action that may have tax consequences.
Copyright © 2023 Members' Wealth LLC